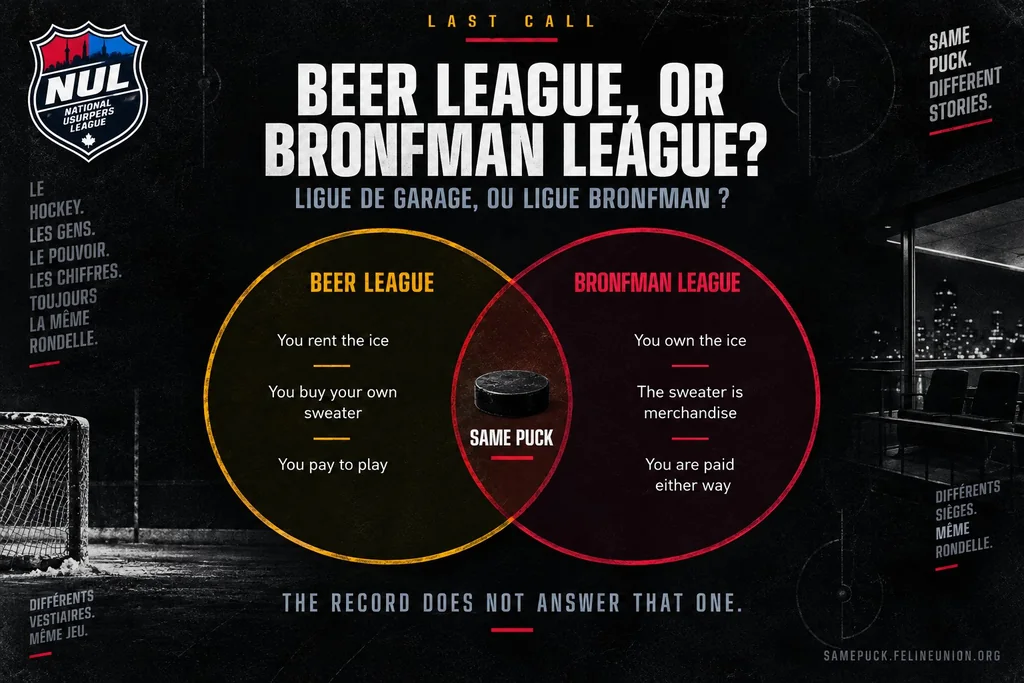

Same puck.Different jerseys.
Eleven Canadian governments since 1968, drawn at the width they actually lasted, over what was done to people while they held the puck. Does anything bend when the jersey changes?


Eleven Canadian governments since 1968, drawn at the width they actually lasted, over what was done to people while they held the puck. Does anything bend when the jersey changes?
Nothing in this record turns on which party held power. Excluding the three governments too short for an annual series to resolve a trend — Clark 273 days, Turner 79, Campbell 132 — the shift in trend at a change of party averages 0.234 points a year for manufacturing employment, against 0.517 at the single same-party handover. Custody, the ownership balance and sitting days run the same way: the handover inside one party moved the line further than the handovers between two.
Two material series run the other way, and this page does not bury them. Private-sector union coverage shifts 0.079 points a year at a change of party against 0.039 at the same-party handover — on a line that falls at almost the same rate under all four governments that can carry a trend, and never turns. Government bills shifts 1.65 against 1.37, on the shortest and noisiest series here, which starts only in 2001. Both margins are small against what those two series do on their own.
Provinces and territories. It rose under Chrétien, under Martin, under Harper and under Trudeau — every year of the record, under both parties. Indigenous people are about five per cent of the population.
The whole record, called end to end by {voices} voices in {min} minutes. The page walks itself to whatever is being talked about; tap a chapter to jump.
Turner gets 79 days of the ice. Chrétien gets 3,690. The red lines are the six changes of governing party.
Four measurable party changes and one same-party handover, on the longest series here; the shorter ones carry fewer. That is not a significance test, and this page does not claim it is.
| Year | Government | Indigenous share of custody admissions | Manufacturing share of employment | Union coverage, private sector | Direct investment balance | Votes cast with the United States at the UN |
|---|---|---|---|---|---|---|
| 1968 | TRUDEAU | 79.25 | ||||
| 1969 | TRUDEAU | 90.24 | ||||
| 1970 | TRUDEAU | 87.30 | ||||
| 1971 | TRUDEAU | 80.26 | ||||
| 1972 | TRUDEAU | 83.85 | ||||
| 1973 | TRUDEAU | 70.69 | ||||
| 1974 | TRUDEAU | 74.31 | ||||
| 1975 | TRUDEAU | 74.44 | ||||
| 1976 | TRUDEAU | 19.09 | 70.88 | |||
| 1977 | TRUDEAU | 18.65 | 83.33 | |||
| 1978 | TRUDEAU | 18.73 | 87.39 | |||
| 1979 | CLARK | 19.08 | 81.07 | |||
| 1980 | TRUDEAU | 18.94 | 82.46 | |||
| 1981 | TRUDEAU | 18.40 | 73.80 | |||
| 1982 | TRUDEAU | 17.11 | 64.57 | |||
| 1983 | TRUDEAU | 16.72 | 68.99 | |||
| 1984 | MULRONEY | 16.99 | 68.85 | |||
| 1985 | MULRONEY | 16.85 | 67.69 | |||
| 1986 | MULRONEY | 16.94 | 67.01 | |||
| 1987 | MULRONEY | 16.55 | 0.70 | 62.96 | ||
| 1988 | MULRONEY | 16.53 | 0.70 | 60.19 | ||
| 1989 | MULRONEY | 16.39 | 0.73 | 57.50 | ||
| 1990 | MULRONEY | 15.67 | 0.75 | 56.70 | ||
| 1991 | MULRONEY | 14.70 | 0.81 | 63.10 | ||
| 1992 | MULRONEY | 14.25 | 0.81 | 58.33 | ||
| 1993 | CHRÉTIEN | 13.91 | 0.87 | 60.67 | ||
| 1994 | CHRÉTIEN | 13.96 | 0.95 | 65.73 | ||
| 1995 | CHRÉTIEN | 14.32 | 0.96 | 69.15 | ||
| 1996 | CHRÉTIEN | 14.34 | 1.00 | 65.93 | ||
| 1997 | CHRÉTIEN | 14.74 | 21.30 | 1.13 | 63.74 | |
| 1998 | CHRÉTIEN | 14.97 | 20.88 | 1.20 | 61.73 | |
| 1999 | CHRÉTIEN | 15.18 | 19.92 | 1.15 | 63.92 | |
| 2000 | CHRÉTIEN | 15.19 | 20.21 | 1.12 | 60.84 | |
| 2001 | CHRÉTIEN | 17.28 | ||||
| 2001 | CHRÉTIEN | 14.88 | 19.93 | 1.17 | 57.30 | |
| 2002 | CHRÉTIEN | 16.66 | ||||
| 2002 | CHRÉTIEN | 14.97 | 19.66 | 1.22 | 50.75 | |
| 2003 | CHRÉTIEN | 17.28 | ||||
| 2003 | MARTIN | 14.54 | 19.85 | 1.10 | 50.00 | |
| 2004 | MARTIN | 17.90 | ||||
| 2004 | MARTIN | 14.43 | 18.99 | 1.18 | 49.45 | |
| 2005 | MARTIN | 18.02 | ||||
| 2005 | MARTIN | 13.67 | 19.31 | 1.14 | 50.00 | |
| 2006 | HARPER | 21.31 | ||||
| 2006 | HARPER | 12.74 | 18.50 | 1.19 | 54.09 | |
| 2007 | HARPER | 21.30 | ||||
| 2007 | HARPER | 12.00 | 18.09 | 1.01 | 53.65 | |
| 2008 | HARPER | 21.29 | ||||
| 2008 | HARPER | 11.30 | 17.48 | 1.17 | 57.14 | |
| 2009 | HARPER | 22.67 | ||||
| 2009 | HARPER | 10.52 | 17.43 | 1.10 | 73.21 | |
| 2010 | HARPER | 24.40 | ||||
| 2010 | HARPER | 10.22 | 17.15 | 1.08 | 71.20 | |
| 2011 | HARPER | 25.70 | ||||
| 2011 | HARPER | 10.10 | 16.98 | 1.12 | 88.61 | |
| 2012 | HARPER | 26.62 | ||||
| 2012 | HARPER | 10.16 | 17.21 | 1.11 | 82.42 | |
| 2013 | HARPER | 25.03 | ||||
| 2013 | HARPER | 9.85 | 17.12 | 1.13 | 87.77 | |
| 2014 | HARPER | 25.76 | ||||
| 2014 | HARPER | 9.75 | 16.33 | 1.14 | 81.12 | |
| 2015 | HARPER | 26.15 | ||||
| 2015 | TRUDEAU | 9.72 | 16.37 | 1.33 | 86.84 | |
| 2016 | TRUDEAU | 29.97 | ||||
| 2016 | TRUDEAU | 9.62 | 15.88 | 1.36 | 87.50 | |
| 2017 | TRUDEAU | 29.98 | ||||
| 2017 | TRUDEAU | 9.61 | 16.18 | 1.44 | 75.20 | |
| 2018 | TRUDEAU | 30.34 | ||||
| 2018 | TRUDEAU | 9.54 | 15.65 | 1.44 | 58.29 | |
| 2019 | TRUDEAU | 30.60 | ||||
| 2019 | TRUDEAU | 9.21 | 15.95 | 1.42 | 61.36 | |
| 2020 | TRUDEAU | 29.92 | ||||
| 2020 | TRUDEAU | 9.30 | 15.98 | 1.55 | 67.21 | |
| 2021 | TRUDEAU | 31.40 | ||||
| 2021 | TRUDEAU | 9.26 | 15.37 | 1.52 | 80.52 | |
| 2022 | TRUDEAU | 31.25 | ||||
| 2022 | TRUDEAU | 9.11 | 15.17 | 1.50 | 88.21 | |
| 2023 | TRUDEAU | 30.45 | ||||
| 2023 | TRUDEAU | 9.07 | 15.57 | 1.52 | 84.70 | |
| 2024 | TRUDEAU | 31.10 | ||||
| 2024 | TRUDEAU | 8.92 | 14.97 | 1.58 | 76.11 | |
| 2025 | CARNEY | 8.78 | 15.08 | 1.52 |
The General Assembly is where the calls get made, and Canada has been on the ice for every one of them. This is the one family of series on this page that moves when the jersey changes. Not a factory, not a wage, not a cell. A vote.
Canada voted with the United States in half of all General Assembly votes when Harper took office, and in eighty-six per cent of them by the time he left. Trudeau brought it back to seventy-six. The shift at a change of party averages 2.51 points a year here, against 1.19 at the same-party handover — twice as much, where every line on the bench does the opposite.
Through the 1990s Canada voted with Russia in seventy-nine per cent of General Assembly votes — more often than it voted with the United States in the same decade. Agreement peaked at eighty-five per cent in 1993, at the end of Mulroney's Progressive Conservative government, and was still above seventy when Harper took office. It was forty-six by the time he left. That turn dates to 2006, and it is the hardest bend anywhere in this record: 3.32 points a year at a change of party against 0.19 at the same-party handover, seventeen times as much.
Iran runs the same way in the same window. Canada agreed with Iran in seven votes out of ten under the first Trudeau government, in fifty-nine per cent of them when Harper took office, and in thirty-four by the time he left. Unlike Russia it came partly back, to forty-five by 2024. But Iran is the one line here that does not clear its own test: its shift at a change of party, 2.08 points a year, is smaller than the 2.93 at the single same-party handover on record.
A vote is not a soldier, and this line does not measure one. In 1918 Canada sent about four thousand troops to Siberia to fight the Bolsheviks; they were home by June 1919. In 1949 it was a founding member of NATO, an alliance written against the Soviet Union. In 2014 it launched Operation REASSURANCE, and it now keeps roughly two thousand soldiers in Latvia and more than three thousand across Europe, extended through 2031. Vladivostok to Latvia is a hundred and thirteen years. On that measure the posture is not two decades old — and it does not bend at a change of party either. It was begun under Harper, carried through Trudeau, and extended under Carney.
Two moving parties. This measures agreement between Canada and one other state, so either side can move it. Much of the rise through the 1980s is the Soviet Union's own position changing rather than Canada's, and the seat itself changed hands twice: Russia succeeded the Soviet Union in 1992, the republic succeeded the imperial state in 1979. The record can date when the agreement turned. It cannot say which side turned.
So the jersey does change something. It changes who Canada votes with. It does not change the manufacturing line, the union rate, the ownership balance, who ends up in a cell, or where the troops go.
This page has room for one counterpart. The full record — 199 states, 1946 to 2024, and where Canada sat against every one of them — is the room next door.
Canada has stood for a seat on the Security Council twice in the past two decades, under each party in turn, and lost both times. The threshold is two-thirds of the General Assembly.
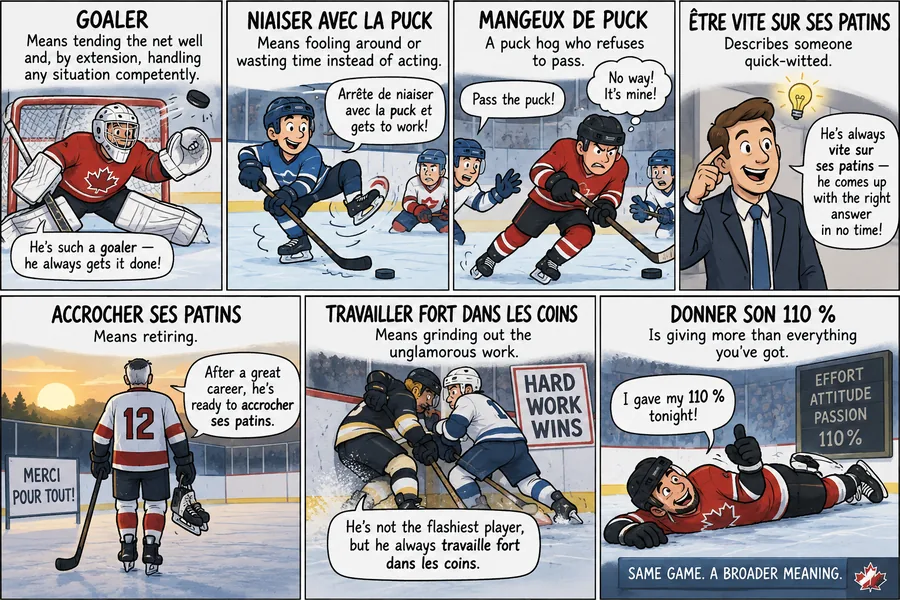
Each lens is a Québécois hockey expression, and each one reduces the record above differently — never into a different argument. The row matching the government selected on the bench is marked.
Two lines, one axis. China’s share of what Canada buys, against manufacturing’s share of who Canada employs.
Between 1999 and 2009 the share of Canadian imports coming from China rose from 2.79 per cent to 10.86 per cent, while manufacturing’s share of employment fell from 15.18 per cent to 10.52 per cent. They crossed in 2009. That decade runs Chrétien to Martin to Harper — Liberal, Liberal, Conservative — and neither line notices the handover in 2006.
Two lines moving in opposite directions at the same time is not proof that one moved the other. This record can date the crossing; it cannot settle what caused it.
The mechanism — the accession terms, the asset sales, the money that came back — is worked through in a separate set of files.


Nothing in here is for sale.
The ten cards are real. They are free, they open ready to post, and every figure on one comes from the record on this page. The packs are not real and the prices are a joke — the index under them is not.
Ten cards, each one a figure from the record. Tap one to open it, then post it or save the image.
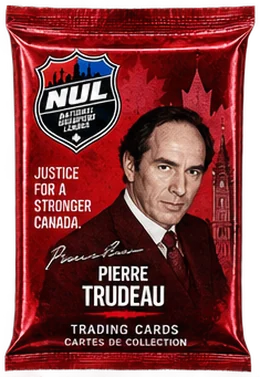

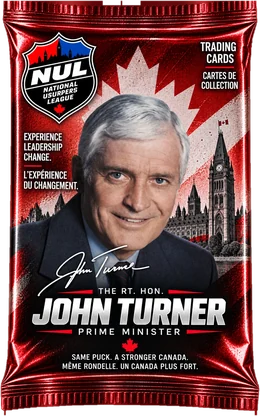

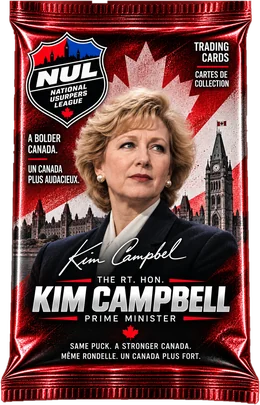


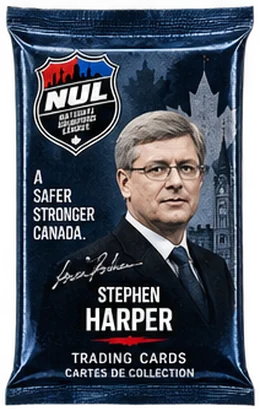
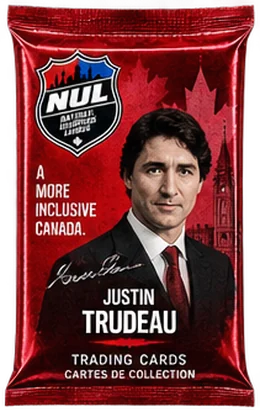
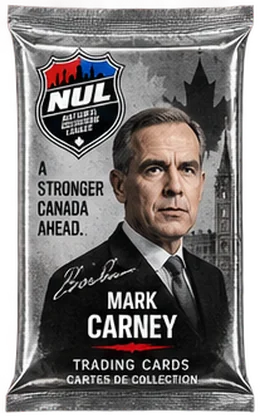
Ten prime ministers since 1968, in the order they held the puck. Turner’s government lasted 79 days and it gets a pack anyway.
The prices are a joke. The line under them is not.
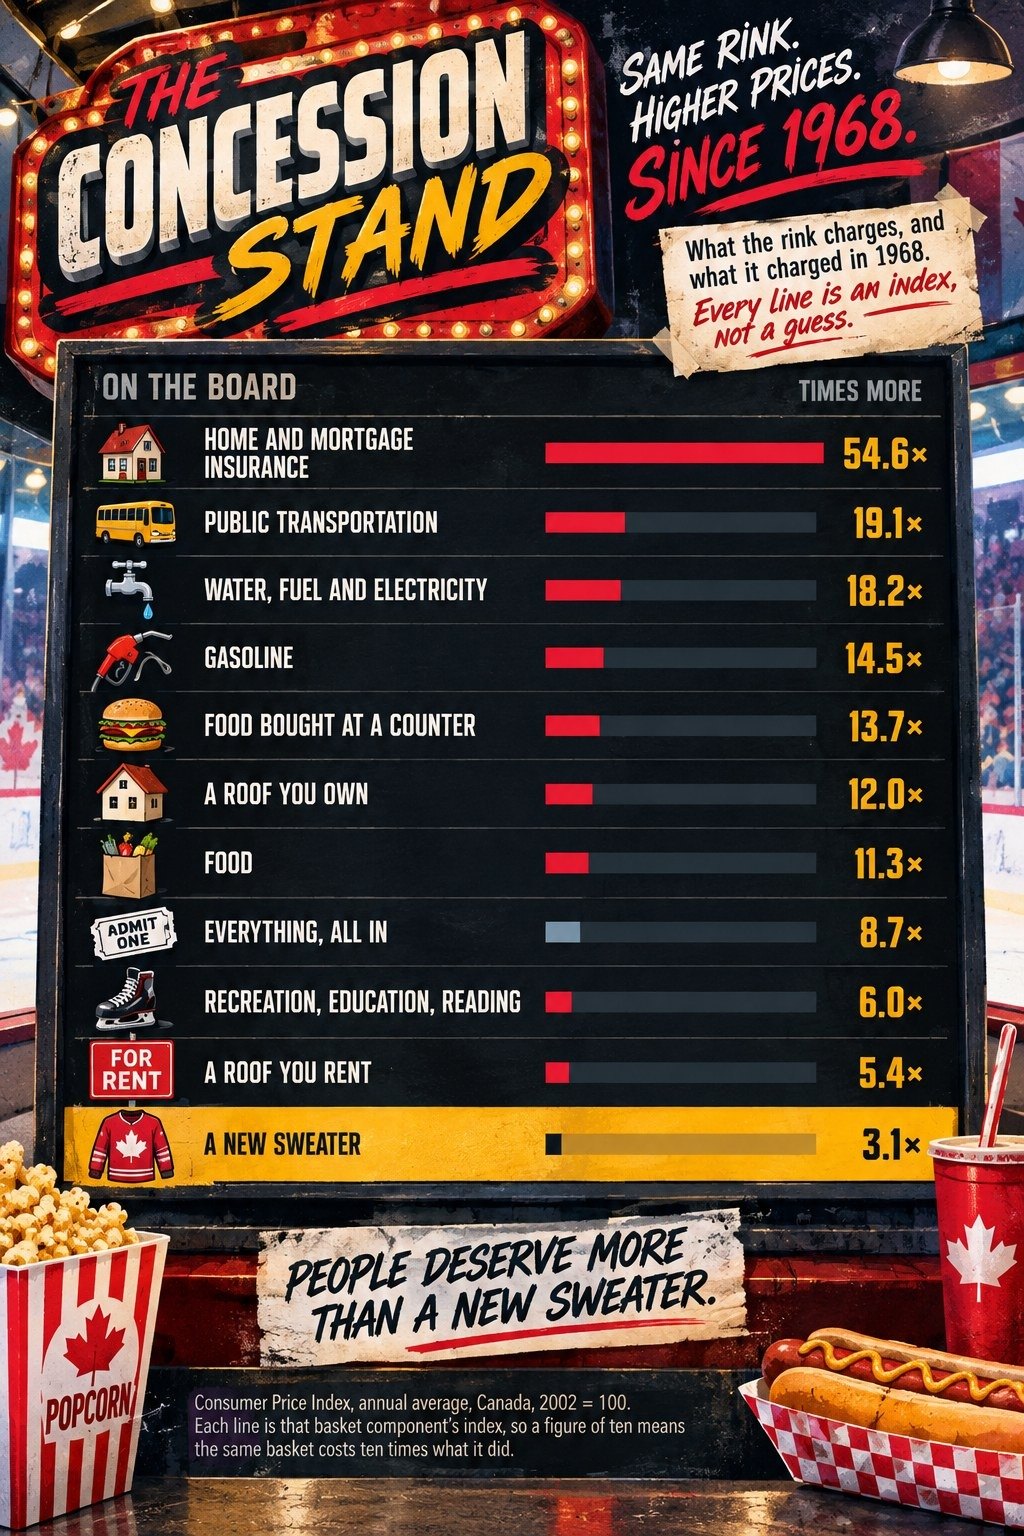
Some prices go up faster than wages.
Between 1997 and 2025 the median hourly wage in Canada rose from $14.00 to $30.77, a shade over double. The whole basket rose less than that — everything, all in, went up 82 per cent while the median wage went up 120. But five things on the board beat it: insuring a home rose twice as fast as wages, and gasoline, utilities, counter food and transit all edged past. A new sweater is the other way entirely — it costs less in plain dollars now than it did in 1997.
Six kinds of card. No such set exists — but every count below is a rule applied to the record, not a print run decided by a marketing department.
The rare card is the one the set is about.
Four of the ten handovers since 1968 kept the same party: Trudeau to Turner, Mulroney to Campbell, Chrétien to Martin and Trudeau to Carney. A handover inside a party is the only one that holds the jersey still while everything else keeps moving, which is why it is the card worth pulling — it is the only place you can read what a change of party is actually worth.